What does each report show?
Reports have five views: Overview, Financial, Operations, Pipeline and Team. Each figure's exact meaning is in What does each report figure mean?
Open a view
- Choose Reports in the sidebar on the web, or tap More, then Reports in the app.
- Pick a view across the top of Reports, or a tab in the app.
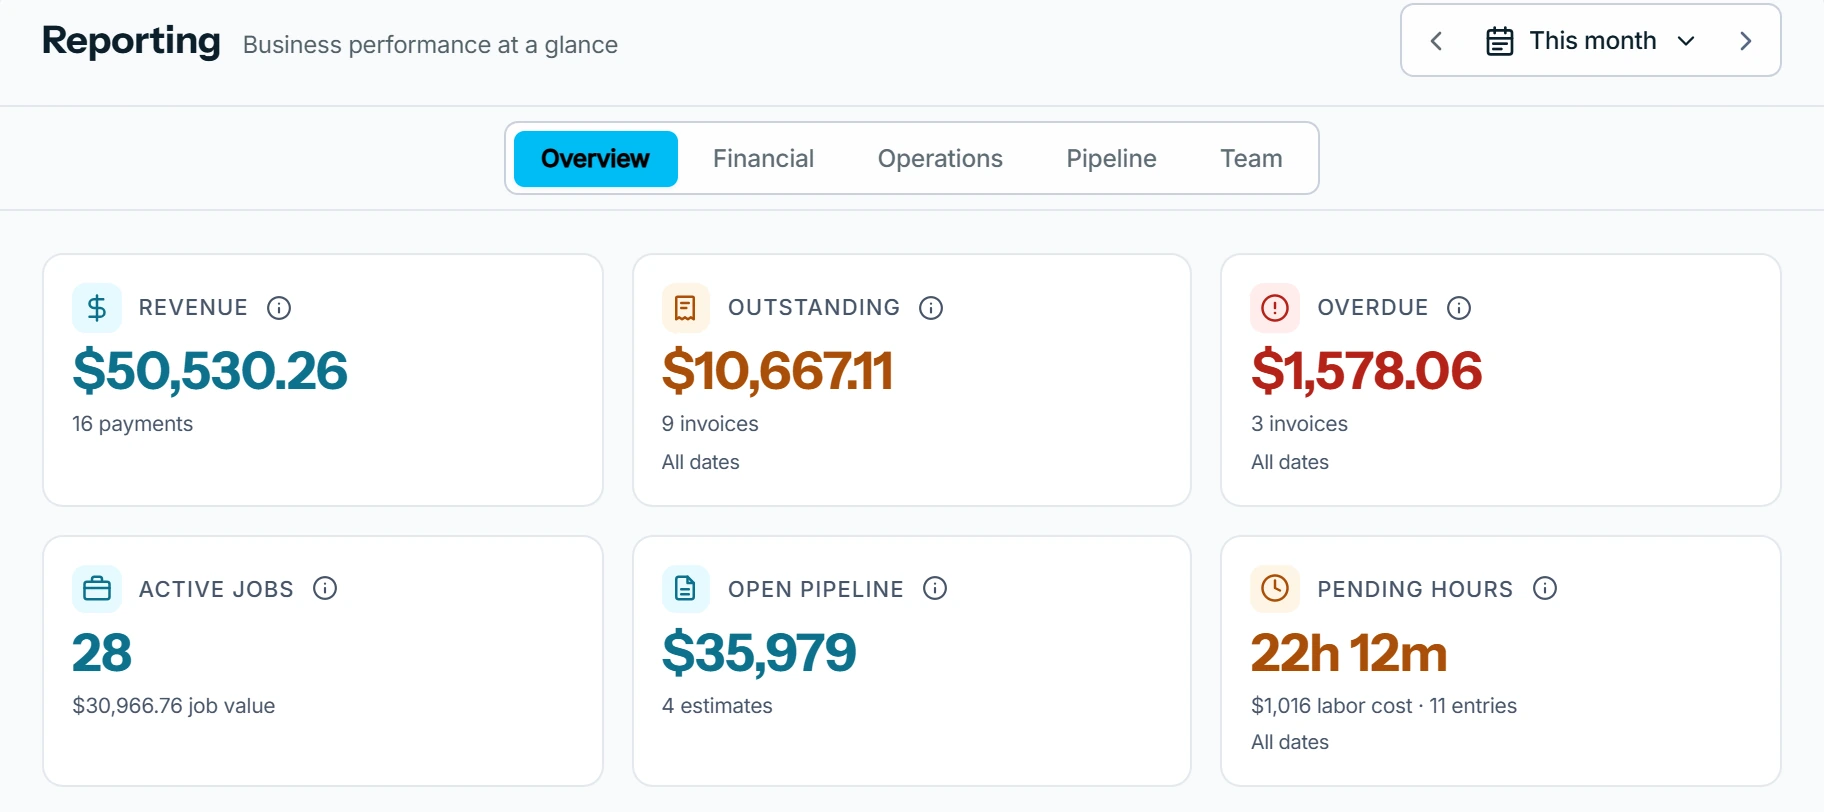
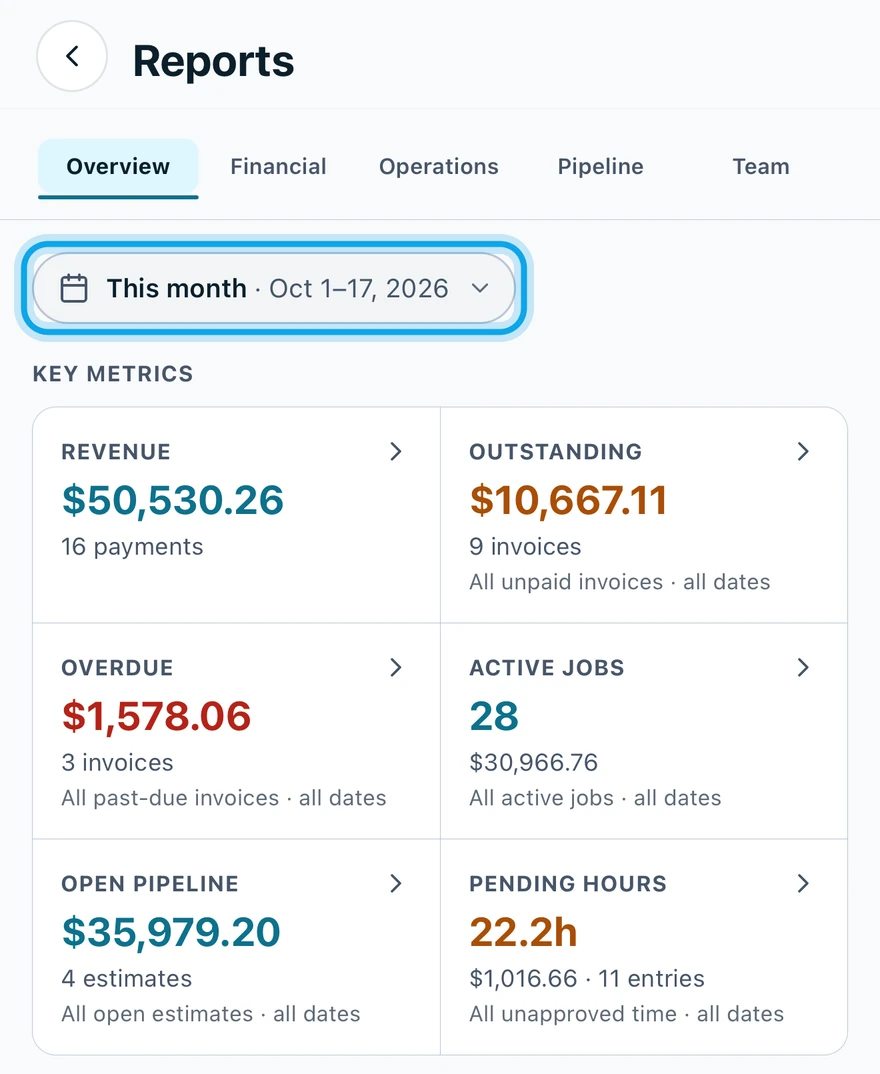
What you see
- Overview: Revenue, Outstanding, Overdue, Active jobs, Open pipeline, Pending approval and a revenue trend.
- Financial: Payments received, Outstanding and Overdue invoices, Avg invoice, Expenses, Gross profit, Profit margin and the Invoice summary.
- Operations: active, overdue, completed and canceled jobs, Total visits, Visit completion, Avg completion and Jobs by status.
- Pipeline: Estimates sent, Conversion rate, Avg estimate, Open pipeline, Expiring soon, Estimate outcomes and Sales rep performance.
- Team: Approved hours, Pending approval, Labor cost, Expenses, Avg labor / job, Technicians and Timesheet approval status.
Payments received counts money collected, not work done. Team is hidden while you work alone.
Who can do this
Reports need View reports: owners, admins and office by default. Cost, margin and profit figures also need View cost & profit, held by owners and admins.